
Conducted Emissions Tester
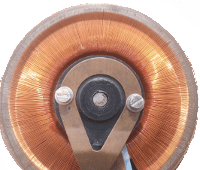
The goal of this project is to make a small LISN (Line Impedance Stabilization Network) to "see" with spectrum analyser or oscilloscope with FFT the noise on power line.Why ?
The goal of this project is to make a small LISN (Line Impedance Stabilization Network) to "see" with spectrum analyser or oscilloscope with FFT the noise on power line.
Why ?
Only a few people like EMC compatibility issues ... In most common case, i (and, i think a lot of electronic hobbyist) don't think about emc questions when prototyping. Last week, i've got a lot of noise problems on a (quite) low frequency oscillator. For three days, i've observed reasonable performance the mornings and very bad stability in the evenings. The offender was an energy saving lamp ..!
Maybe other people here have lamps who loves jokes ... :)
Build This Project
Bring this design to life with the Elektor PCB Service, powered by Eurocircuits. Upload the project files and order professionally manufactured PCBs or assembled boards through a proven European production platform.
Supporting KiCad, Eagle, Gerber, and ODB++ formats, the service is suitable for everything from prototypes and validation builds to series production and volume manufacturing.
Made in Europe. Fast. Reliable. Professional.
Discussie (2 opmerking(en))