
Electricity [Grid] Frequency Meter V2
Measure the frequency on the national grid and determine the load on the generating equipment.
This is an update to a design published here when registered under a different username. I have lost my password used for that project, so can't update it. The original project can be found here: https://www.elektormagazine.com/labs/electricity-grid-frequency-meter
A few years ago I saw an article in Elektor Magazine written by Dieter Laues which showed how it was possible to determine the load on the National Grid electricity supply by measuring the frequency of the supply. To sum it up in a few words: The greater the load, the more it slows down the generators and so the lower the frequency of the supply.
The National Grid is compelled in the UK to maintain the frequency of the supply to +/- 1% of the nominal frequency of 50Hz, the limits being 49.5Hz and 50.5Hz. However it aims to keep this to within +/- 0.2Hz normally (49.8Hz - 50.2Hz). A very large power cut across parts of the UK was caused by these limits being exceeded. Two large generating plants failed almost together and the sudden loss of supply caused the remaining power plants to become excessively loaded, lowering the frequency. To keep within the operating limits, large parts of the country were essentially unplugged to allow the remaining plants to continue to work. Reserve power was brought online and power was eventually returned.
This meter can measure the frequency reasonably accurately, with a resolution on the bargraph display of 0.025Hz (25 mHz). I did an original design some years ago using PicAxe processors. This has worked well. I have one in the living room which has been running for over five years. Due to limitations in the mathematics abilities of the PicAxe, the maths was rather compromised, very convoluted and untidy. It did work though. I have finally rewritten the code using Great Cow Basic.
The new design is (not surprisingly!) based almost entirely on the hardware used for the original. I've added a few minor tweaks, but it is very close to the original. The new model in the pictures uses one of the original PCBs, this only "needs" a solder link to be added to make it work. I have redesigned an entirely new PCB which I've ordered.
The software is a grounds-up rebuild. A few of the constant values are the same as the original but not much else. Given the horrid maths I needed to make the PicAxe calculate frequency from a time period, I felt it was not really worth trying to alter it, but to start again. The frequency is also able to be averaged over 20 samples now which adds some much needed stability to the display. The voltage can also now be averaged and shows the voltage to 0.1V The PicAxe original did have this option, but the jitter between readings was too much for it to be useable so I removed it.
The circuit diagram is included as a PDF. The circuit shows alternate locations for LCD displays. One is for a standard 1602 type, the other is to accomodate a large digit type I have a few of. These have pin 16 and 15 on the lower left of the displays, with pin 1 next to pin 15 and pin 14 on the extreme right. This circuit is the basis of my PCB, I deleted the two displays not relevant for my board.
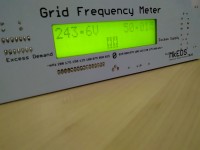
There is a picture of the original (PicAxe) version and two of the new PIC version, the new ones have a white label on the Volts calibration potentiometer to remind me which way decreases the voltage reading from where I was calibrating this yesterday.
One of the pictures of the new version is showing a power failure event. The event flag at the top of the display is showing an event took place, the down arrow indicates that the voltage fell below 5% of the nominal voltage and in the empty side of the bargraph, every 60 seconds or so, for 10 seconds, the time in hours and minutes since the event took place (or since power resumed) is shown. After 1 day, this time is displayed in days and hours. After 7 days, this is cleared unless another event took place in the meantime. The events are stored in EeProm, and assuming there was enough time to write to EeProm before the supply went totally, the event will be displayed when power returns. As this will store the time that the meter was unplugged, events can be cleared by tapping on the "calibrate" button for less than 500 mS.
YouTube video of the finished project in action: https://youtu.be/l3xduTKacI0
A few years ago I saw an article in Elektor Magazine written by Dieter Laues which showed how it was possible to determine the load on the National Grid electricity supply by measuring the frequency of the supply. To sum it up in a few words: The greater the load, the more it slows down the generators and so the lower the frequency of the supply.
The National Grid is compelled in the UK to maintain the frequency of the supply to +/- 1% of the nominal frequency of 50Hz, the limits being 49.5Hz and 50.5Hz. However it aims to keep this to within +/- 0.2Hz normally (49.8Hz - 50.2Hz). A very large power cut across parts of the UK was caused by these limits being exceeded. Two large generating plants failed almost together and the sudden loss of supply caused the remaining power plants to become excessively loaded, lowering the frequency. To keep within the operating limits, large parts of the country were essentially unplugged to allow the remaining plants to continue to work. Reserve power was brought online and power was eventually returned.
This meter can measure the frequency reasonably accurately, with a resolution on the bargraph display of 0.025Hz (25 mHz). I did an original design some years ago using PicAxe processors. This has worked well. I have one in the living room which has been running for over five years. Due to limitations in the mathematics abilities of the PicAxe, the maths was rather compromised, very convoluted and untidy. It did work though. I have finally rewritten the code using Great Cow Basic.
The new design is (not surprisingly!) based almost entirely on the hardware used for the original. I've added a few minor tweaks, but it is very close to the original. The new model in the pictures uses one of the original PCBs, this only "needs" a solder link to be added to make it work. I have redesigned an entirely new PCB which I've ordered.
The software is a grounds-up rebuild. A few of the constant values are the same as the original but not much else. Given the horrid maths I needed to make the PicAxe calculate frequency from a time period, I felt it was not really worth trying to alter it, but to start again. The frequency is also able to be averaged over 20 samples now which adds some much needed stability to the display. The voltage can also now be averaged and shows the voltage to 0.1V The PicAxe original did have this option, but the jitter between readings was too much for it to be useable so I removed it.
The circuit diagram is included as a PDF. The circuit shows alternate locations for LCD displays. One is for a standard 1602 type, the other is to accomodate a large digit type I have a few of. These have pin 16 and 15 on the lower left of the displays, with pin 1 next to pin 15 and pin 14 on the extreme right. This circuit is the basis of my PCB, I deleted the two displays not relevant for my board.
There is a picture of the original (PicAxe) version and two of the new PIC version, the new ones have a white label on the Volts calibration potentiometer to remind me which way decreases the voltage reading from where I was calibrating this yesterday.
One of the pictures of the new version is showing a power failure event. The event flag at the top of the display is showing an event took place, the down arrow indicates that the voltage fell below 5% of the nominal voltage and in the empty side of the bargraph, every 60 seconds or so, for 10 seconds, the time in hours and minutes since the event took place (or since power resumed) is shown. After 1 day, this time is displayed in days and hours. After 7 days, this is cleared unless another event took place in the meantime. The events are stored in EeProm, and assuming there was enough time to write to EeProm before the supply went totally, the event will be displayed when power returns. As this will store the time that the meter was unplugged, events can be cleared by tapping on the "calibrate" button for less than 500 mS.
YouTube video of the finished project in action: https://youtu.be/l3xduTKacI0
Want to build a project?
Bring your design to life with the Elektor PCB Service, powered by Eurocircuits. Upload the project files and order professionally manufactured PCBs or assembled boards through a proven European production platform.
Supporting KiCad, Eagle, Gerber, and ODB++ formats, the service is suitable for everything from prototypes and validation builds to series production and volume manufacturing.
Made in Europe. Fast. Reliable. Professional.
Updates van de auteur