
Ephemeral Test Equipment
An ESP32 linked with a PC over WiFi to create unique Ephemeral Test Equipment.
Software on a PC or Laptop (Later Cellphone or tablet) interacting, over WiFi (or Bluetooth), with firmware in the module and either temporary external circuitry or prebuilt modules to perform a specific test and then dismantled until needed again for some other purpose.
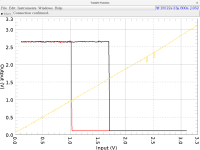
Possible measurements include simple multimeter functions like voltage, current, resistance, to frequency counting and duty cycle measurements. More sophisticated testing would include transient functions (how fast can something react), transfer functions (just where does a Schmitt trigger switch), and curve tracing (D2A generating voltages and A2D measuring currents through a transistor) all the way up to what I've nicknamed "Slow-scilloscope" functions.
The software on the PC can save data in various formats, do further processing such as FFT or THD computations and render graphs in formats suitable for publication.
In addition long term measurements can be performed; Perhaps waiting for that elusive glitch that rarely happens, or measuring the performance of a solar power circuit throughout the day (and night).
Updates van de auteur